Designing a trade promotion management platform that turns financial chaos into recoverable revenue — helping CPG brands stop losing millions to invalid retailer deductions.
Role
Product Designer
Timeline
2024
Tools
Figma, FigJam, Maze, Miro
Type
B2B SaaS — Concept
01 — The Problem
The Problem
Consumer packaged goods brands spend 15–25% of gross revenue on trade promotions — slotting fees, discounts, marketing allowances, and retailer incentives. When those promotions run, retailers deduct the agreed amounts directly from invoices. The problem: 5–10% of those deductions are invalid. Wrong amounts, duplicate charges, promotions that never ran, expired deals still being claimed. For a mid-size CPG brand doing $50M in revenue, that's $375K–$750K in lost profit sitting in unresolved deductions every year.
The existing workflow is brutal. Finance teams manually cross-reference deduction line items against promotion agreements, check libraries, and retailer portals — across spreadsheets, email threads, and disconnected systems. A single deduction can take 45 minutes to validate. By the time the team processes the backlog, the dispute window has closed and the money is gone.
“Invalid deductions cost CPG companies 5–10% of trade claims in lost profit — and most brands don’t have the infrastructure to fight back.”
02 — Research & Discovery
Research & Discovery
I conducted competitive analysis across 5 trade promotion management platforms (Vividly, CPGvision, Promomash, HighRadius, Cresicor) and synthesized published research on deduction management workflows in CPG. The goal was to understand where existing tools create friction for finance teams and where the reconciliation process breaks down.
Fragmented Data
Finance teams toggle between 4–6 systems to validate a single deduction: the ERP for invoice data, the promotion planning tool for deal terms, the retailer portal for backup documents, email for approvals, and spreadsheets for tracking. No single system holds the complete picture.
Invisible Patterns
Teams resolve deductions one at a time without visibility into recurring patterns. The same retailer may be over-deducting on the same promotion type every quarter — but without aggregated analytics, nobody connects the dots. Root causes stay hidden.
Dispute Window Pressure
Most retailer agreements allow 60–90 days to dispute a deduction. With manual validation taking 30–45 minutes per claim and backlogs of hundreds of open deductions, teams triage by dollar amount and let smaller claims expire — accepting preventable losses.
03 — Key Design Decisions
Key Design Decisions
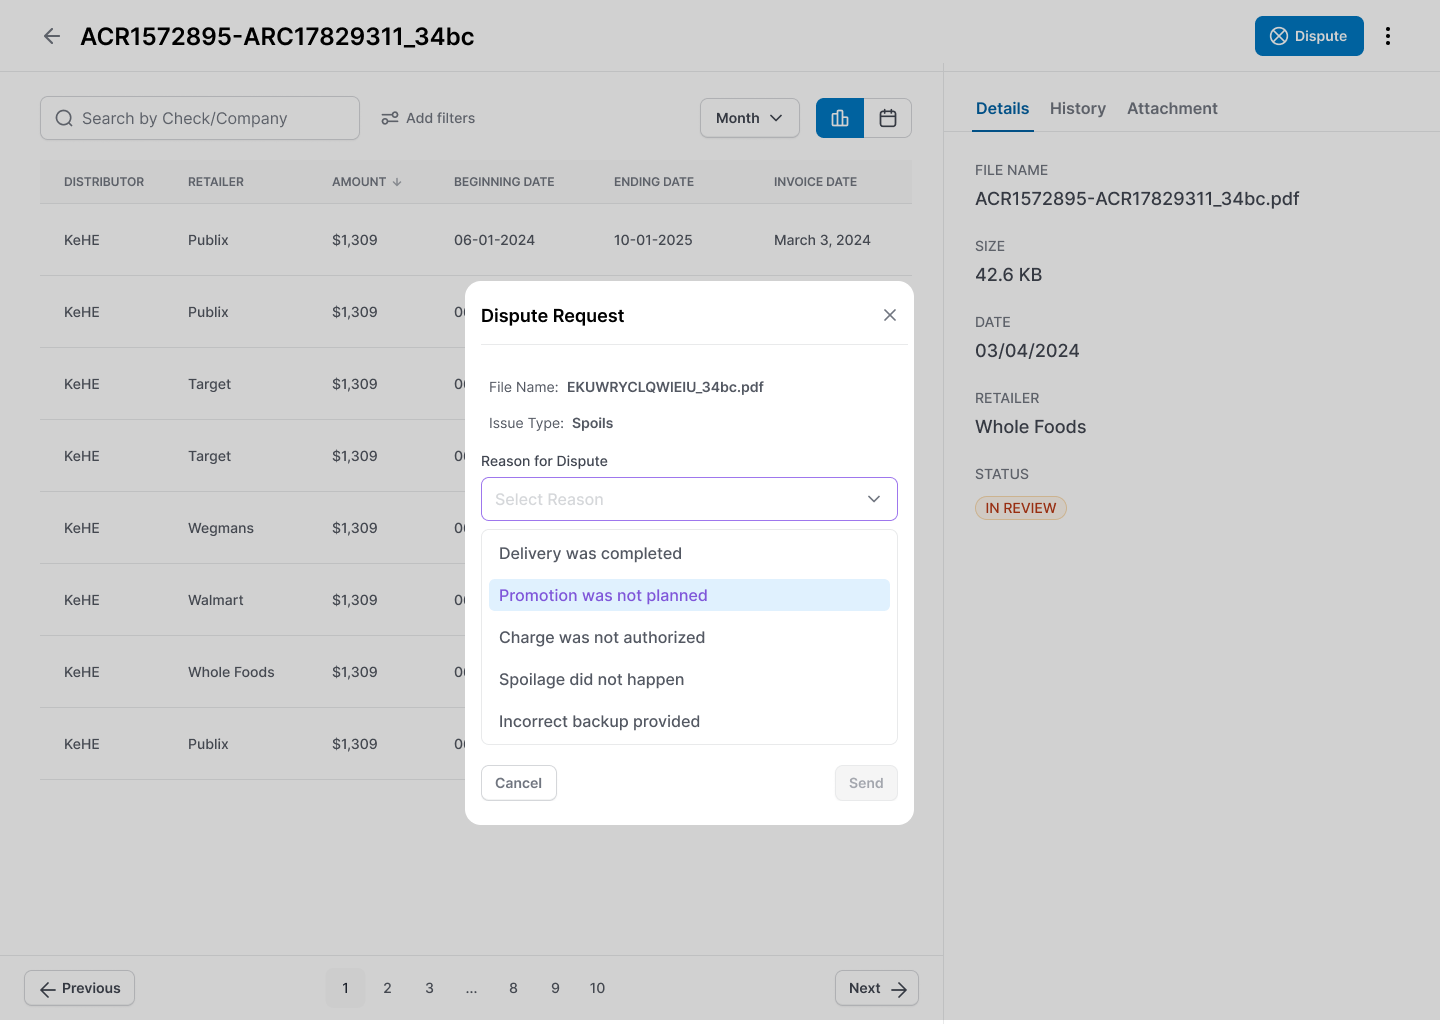
Unified Deduction Workspace
Finance teams waste 60% of validation time just finding the right documents. The deduction record is in one system, the promotion agreement in another, the backup PDF in a retailer portal, and the approval chain in email.
Designed a single deduction detail view with a three-panel layout: data table on the left showing all deduction line items, a details panel on the right showing file metadata (filename, size, date, retailer, status), and a dispute modal that surfaces pre-populated reason categories. The user validates and disputes without leaving the screen.
The ResultEstimated validation time drops from 45 minutes to under 10. The dispute modal pre-populates reason options (Delivery completed, Promotion not planned, Charge not authorized, Spoilage didn't happen, Incorrect backup) — turning a research task into a selection task.
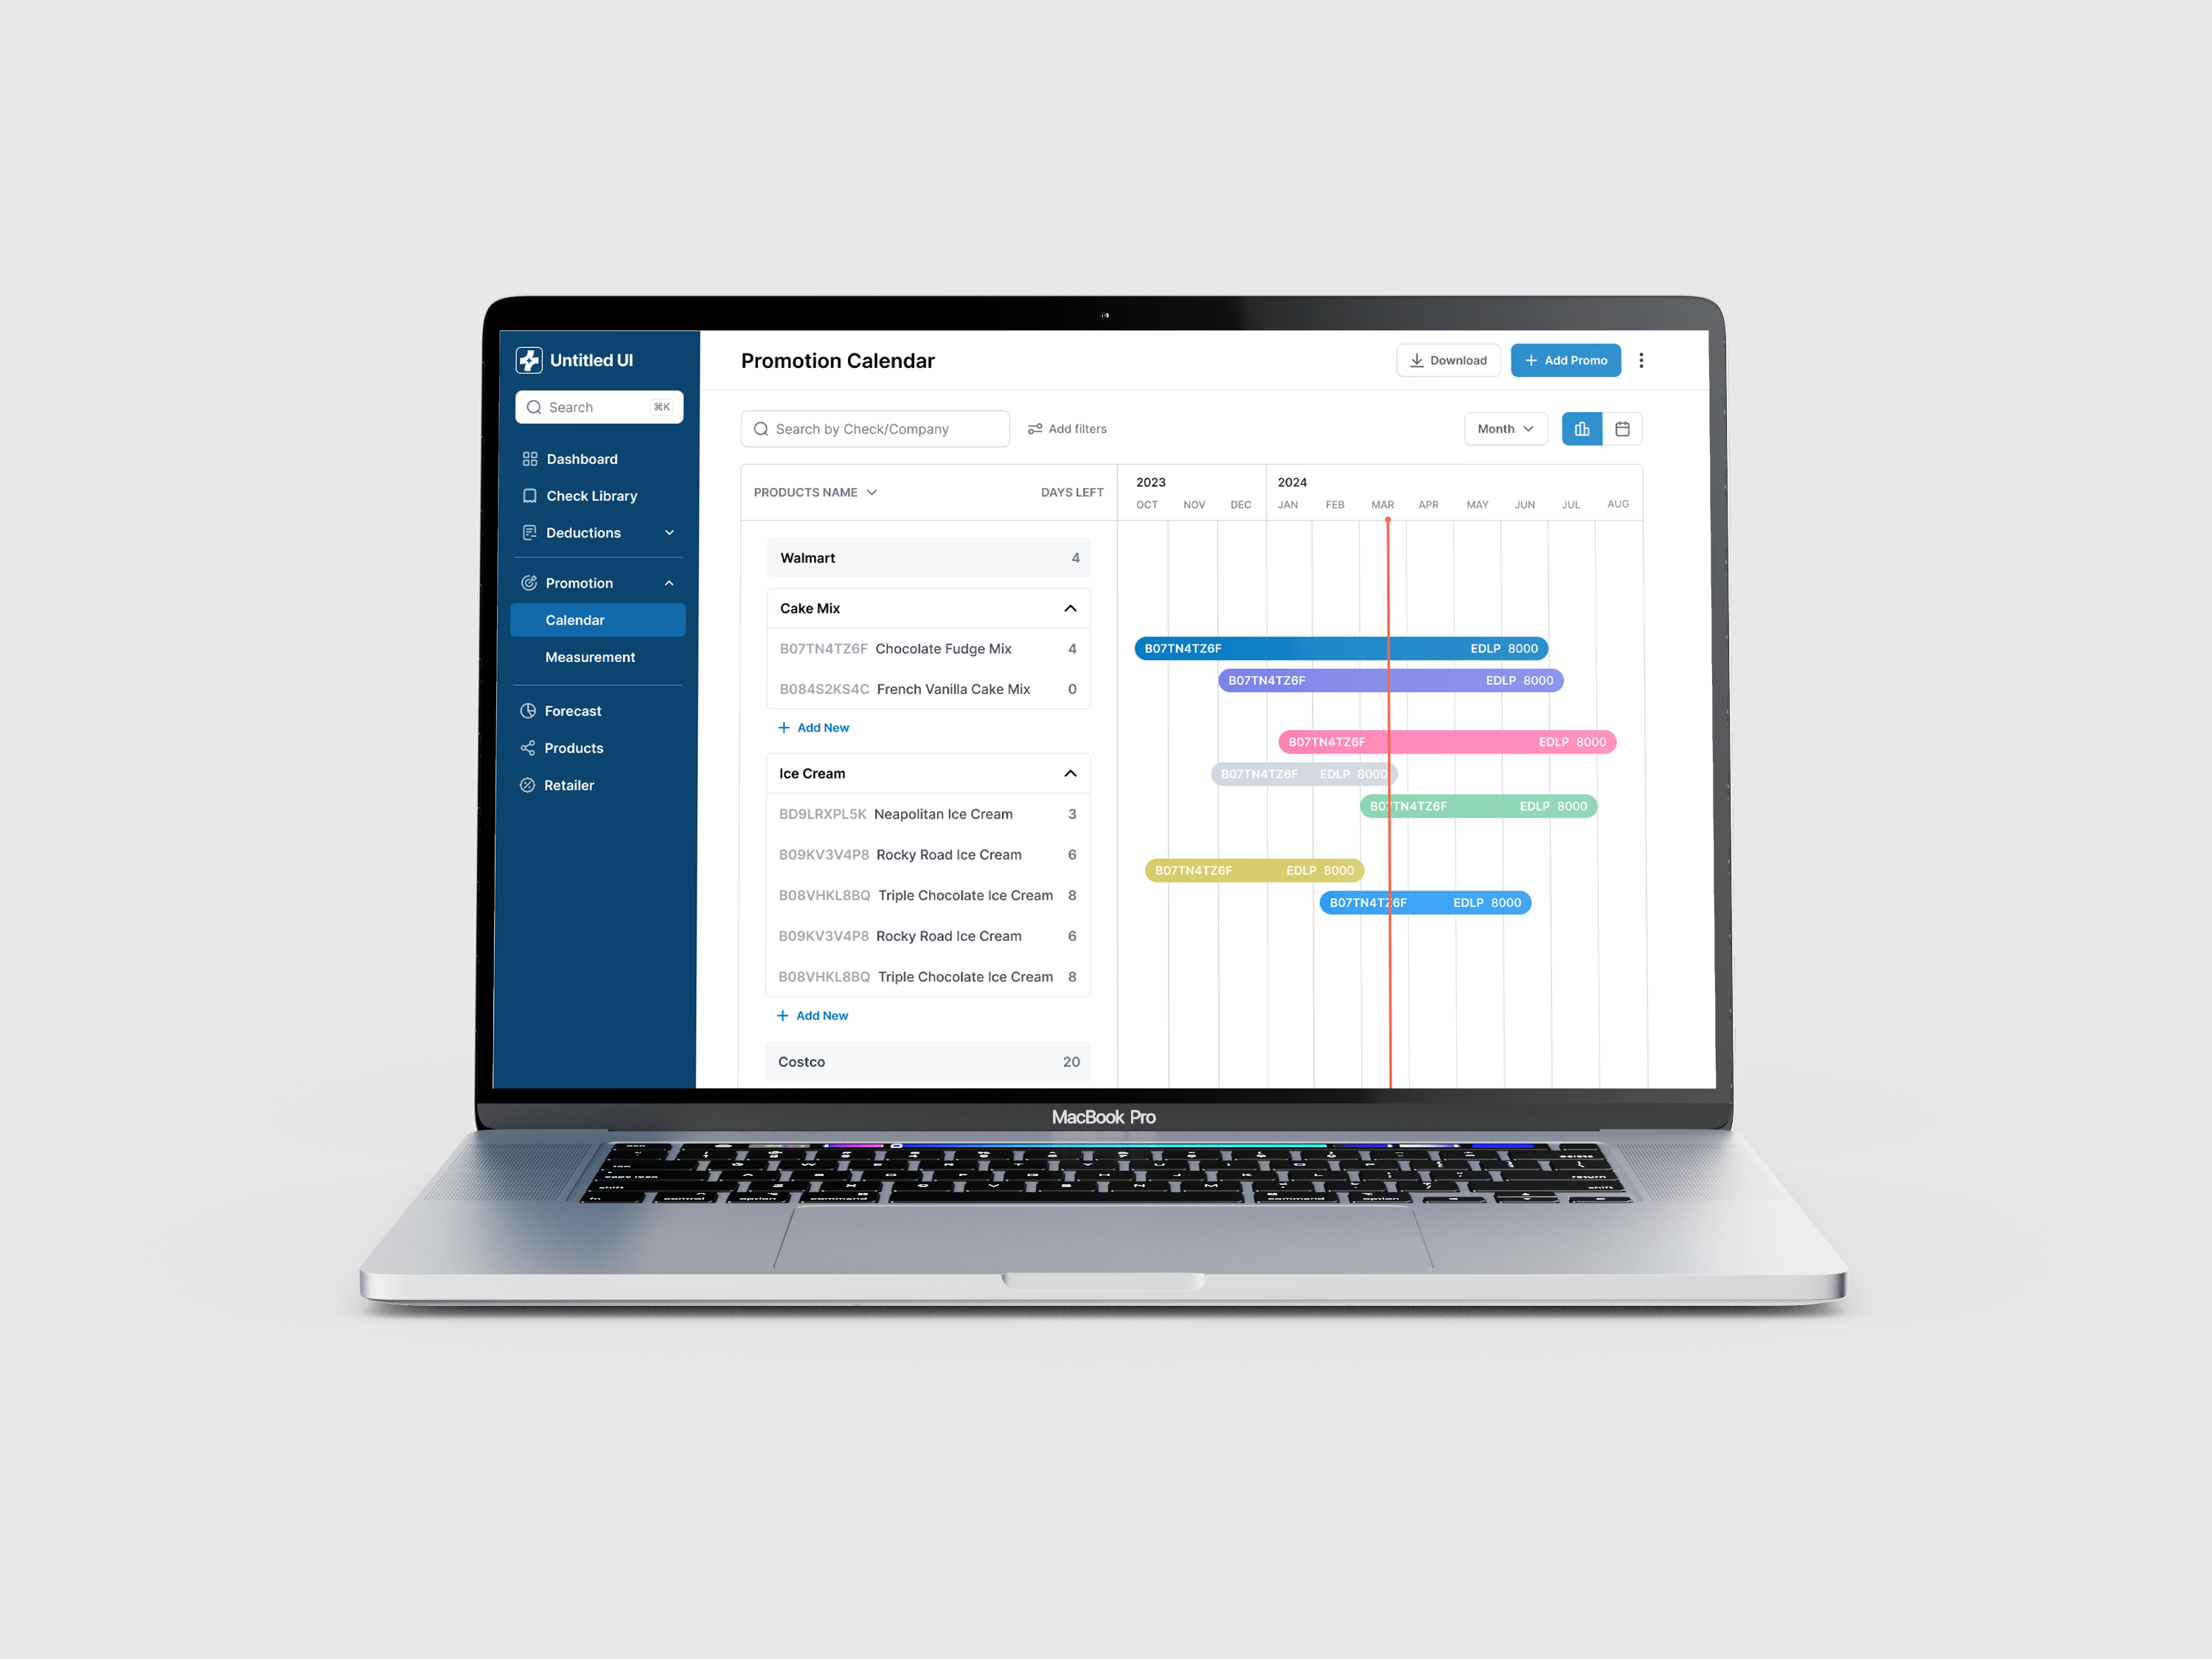
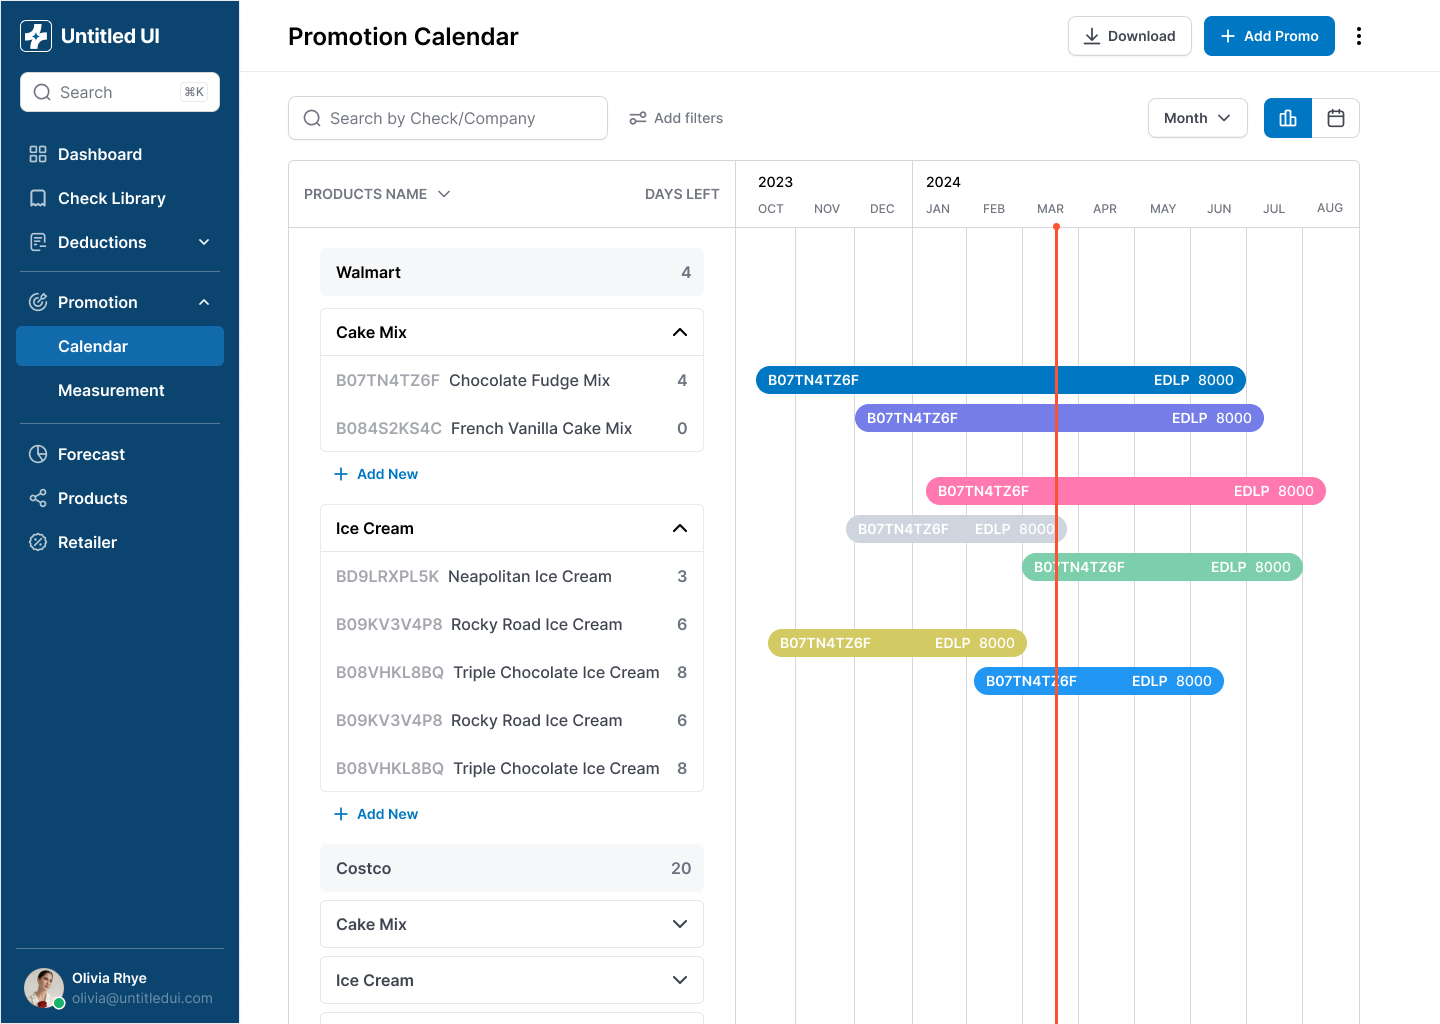
Promotion Calendar as Gantt Timeline
CPG brands run dozens of overlapping promotions across multiple retailers and product lines simultaneously. Existing tools show promotions in flat list views — making it impossible to see scheduling conflicts, coverage gaps, or which products are over-promoted.
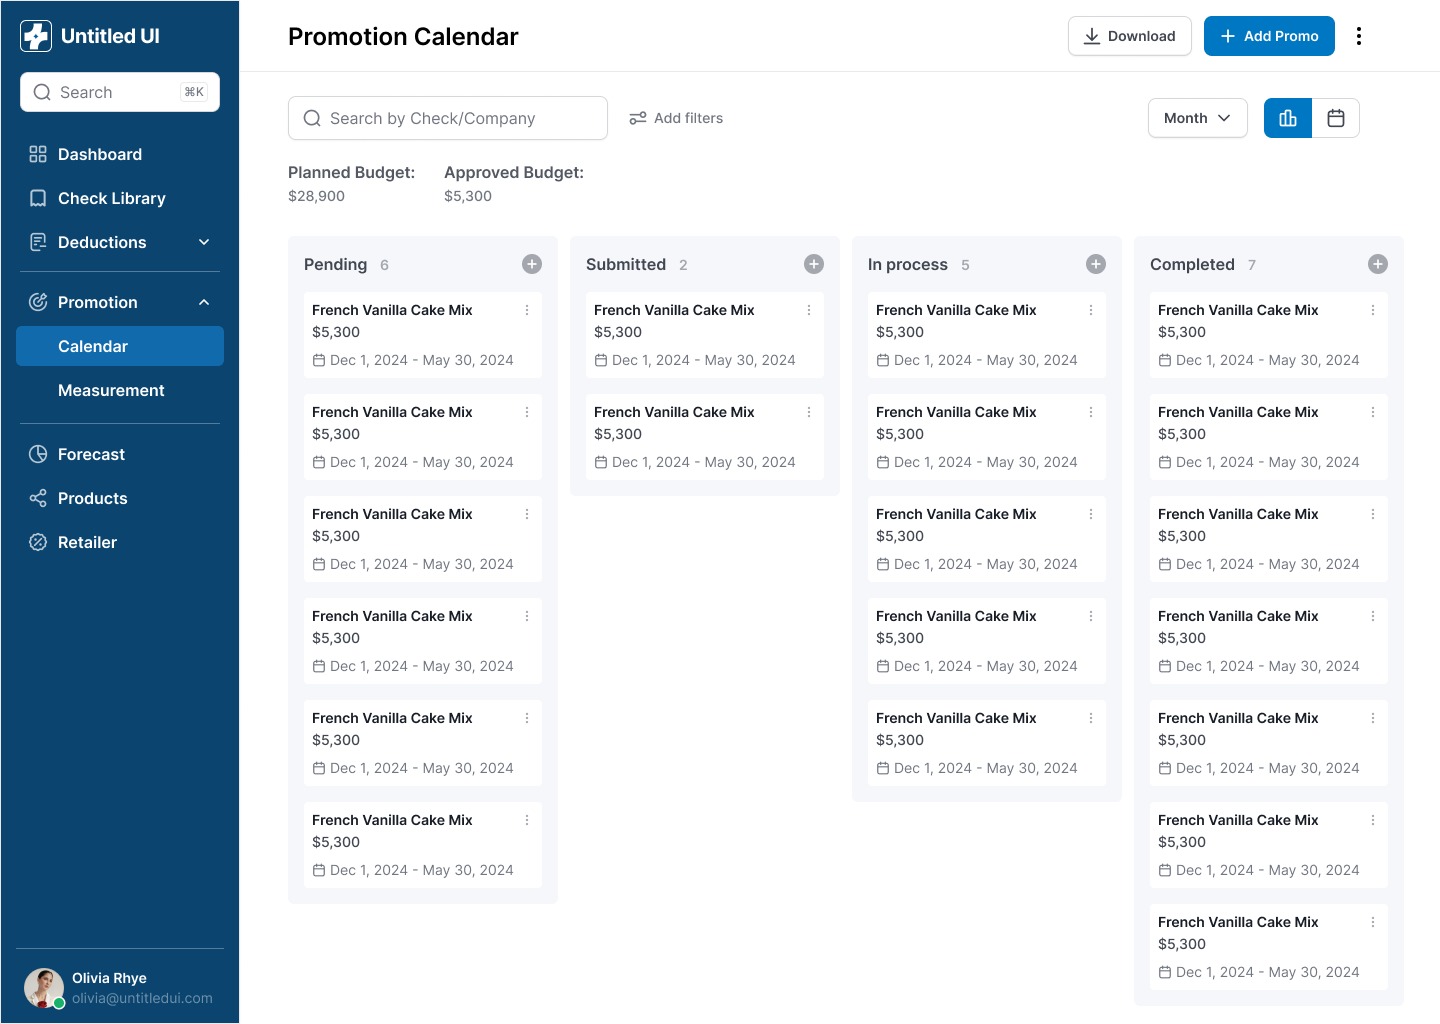
Designed a Gantt-style promotion calendar with a hierarchical left panel (Retailer → Product Category → SKU) and color-coded timeline bars showing promotion duration and type. A toggle switches between the Gantt view and a bar chart summary. The 'today' marker (red vertical line) anchors temporal context.
The ResultFor the first time, brand managers can see their entire promotion portfolio in one view — identifying overlap, gaps, and concentration risk across retailers and product categories at a glance.
Dashboard as Financial Command Center
Finance teams need to answer different questions at different times: 'How much are we spending on promotions this month?' vs. 'Which retailer is costing us the most in deductions?' vs. 'Where are our checks stuck?' Existing dashboards force all this into a single undifferentiated view.
Designed a tabbed dashboard architecture with 7 category tabs (Promotions, Spoils, Slotting, Fines, MCBs, Marketing, Misc) — each showing category-specific metrics. The Promotions tab leads with a calendar bar chart, top line items, spend by retailer, and a deduction-type breakdown donut chart. Alert banners surface unresolved items requiring immediate attention.
The ResultThe tabbed structure lets each team member navigate to their concern without wading through irrelevant data. The alert banners ensure critical items (unprocessed forms, incomplete setup) never get buried below the fold.
Mid-Market Positioning Over Enterprise Feature Parity
The five incumbent TPM platforms (Vividly, CPGvision, Promomash, HighRadius, Cresicor) all compete on feature completeness for enterprise accounts. The instinct when designing a new entrant is to match their feature lists while making the UI cleaner. That approach produces a better-looking product positioned identically — competing for the same $30K+ contracts against entrenched vendors.
Designed Clovr explicitly for the $10M–$200M revenue tier. This meant deliberately cutting features that mid-market teams don't have the headcount to operate — advanced forecasting models, multi-org hierarchies, broker portals — and investing depth in the three workflows where mid-market teams lose the most money: deduction validation, dispute management, and promotion calendar clarity. Every enterprise feature excluded funded a mid-market usability improvement.
The ResultThe competitive gap isn't capability — it's operational fit. A five-person CPG finance team doesn't need a system that requires a dedicated TPM administrator. The mid-market tier is currently served by spreadsheets and ERP exports because existing tools are overbuilt for their needs. Clovr's information architecture is organized around how a small finance team actually divides work, not how an enterprise license structure maps to a software seat.
04 — The Solution
The Solution
Clovr is a trade promotion management and deduction recovery platform designed for mid-market CPG brands — companies doing $10M–$200M in revenue that can’t afford enterprise tools like SAP TPM but can’t survive on spreadsheets. The platform unifies promotion planning, deduction validation, dispute management, sales forecasting, and retailer analytics into a single workspace — with the goal of recovering the 5–10% of trade spend that brands currently lose to invalid deductions.
01 / 07
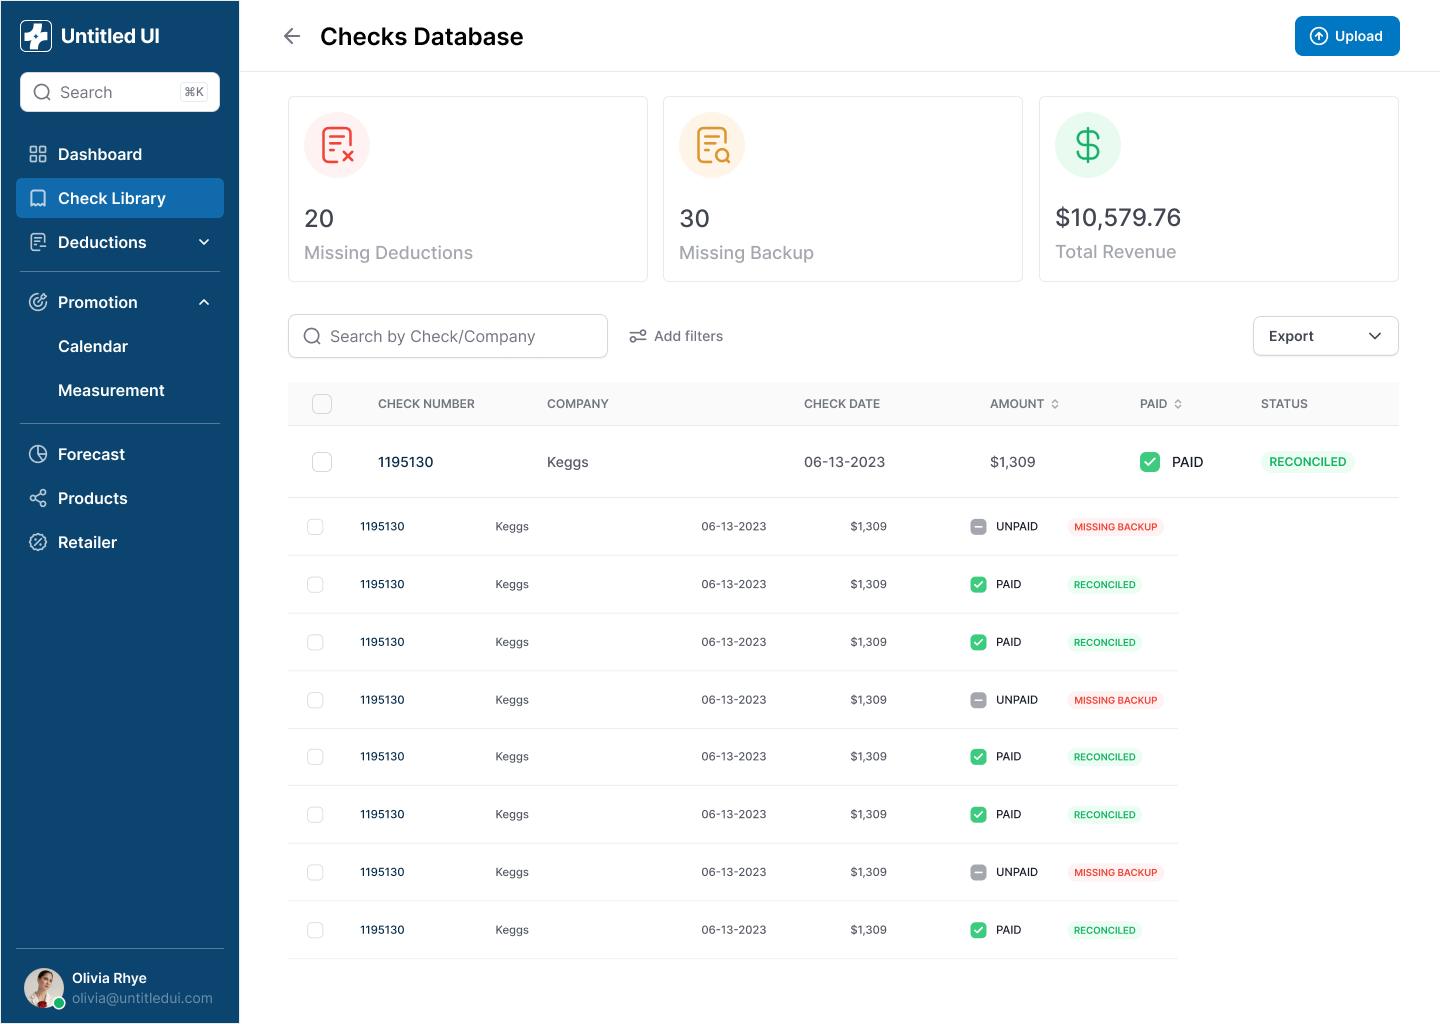
Checks Database
Reconciliation status tracking with PAID/UNPAID/RECONCILED badges
Deduction Detail & Disputes
Three-panel layout with dispute modal and reason categories
Promotion Calendar
Gantt timeline with retailer/product hierarchy and color-coded bars
Promotion Gantt View
Expanded Gantt timeline with detailed promotion periods
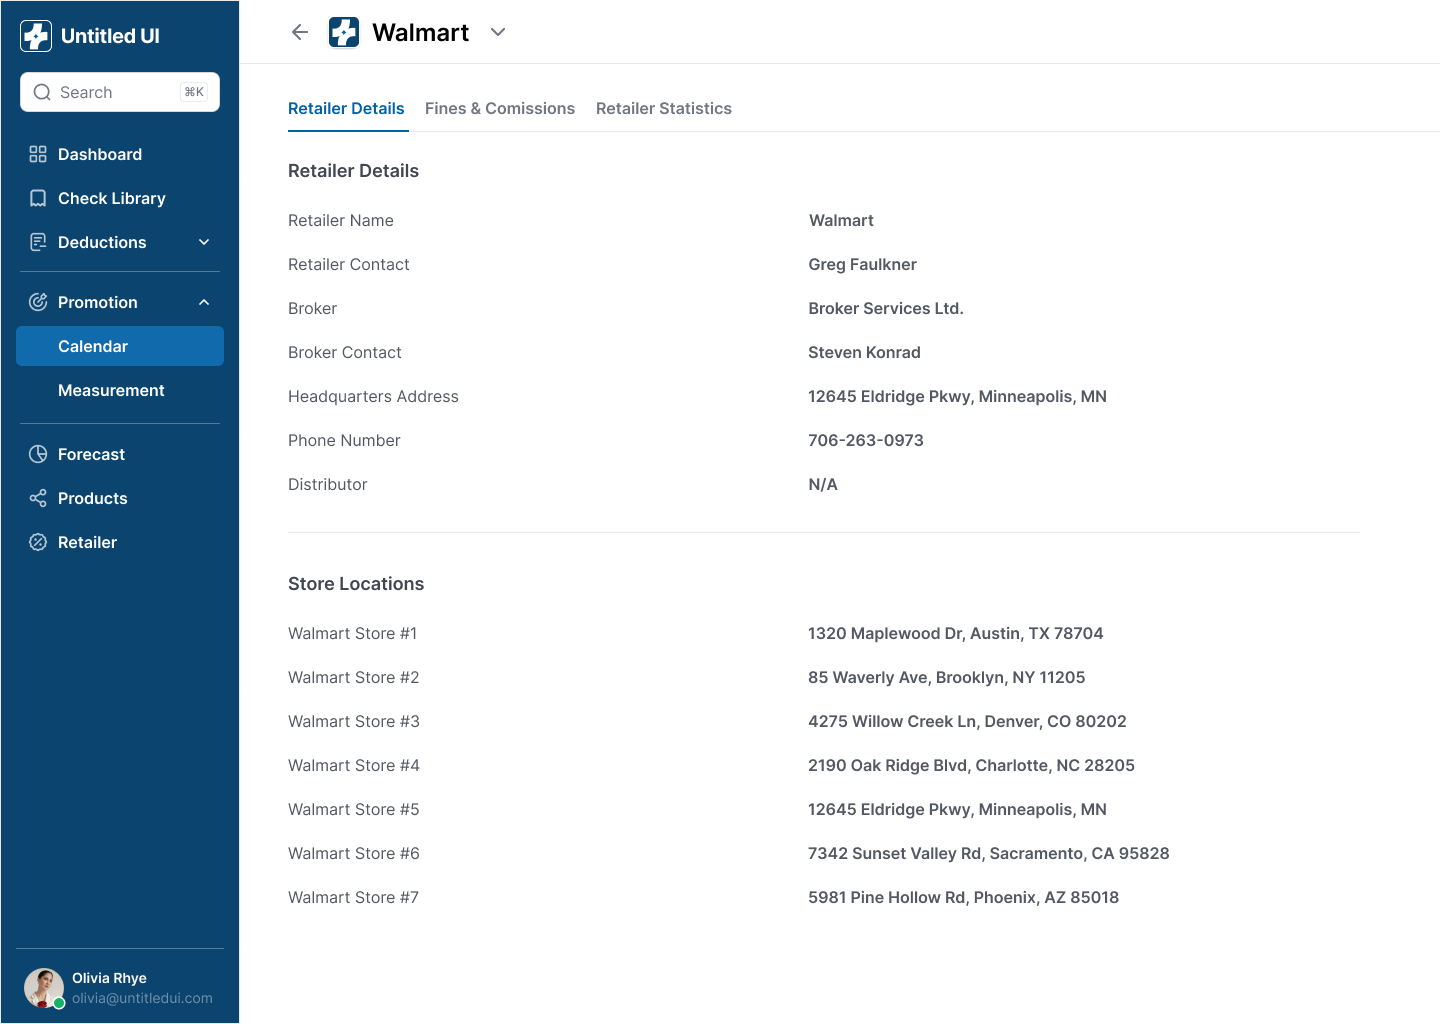
Retailer Details
Contact info, broker details, store locations
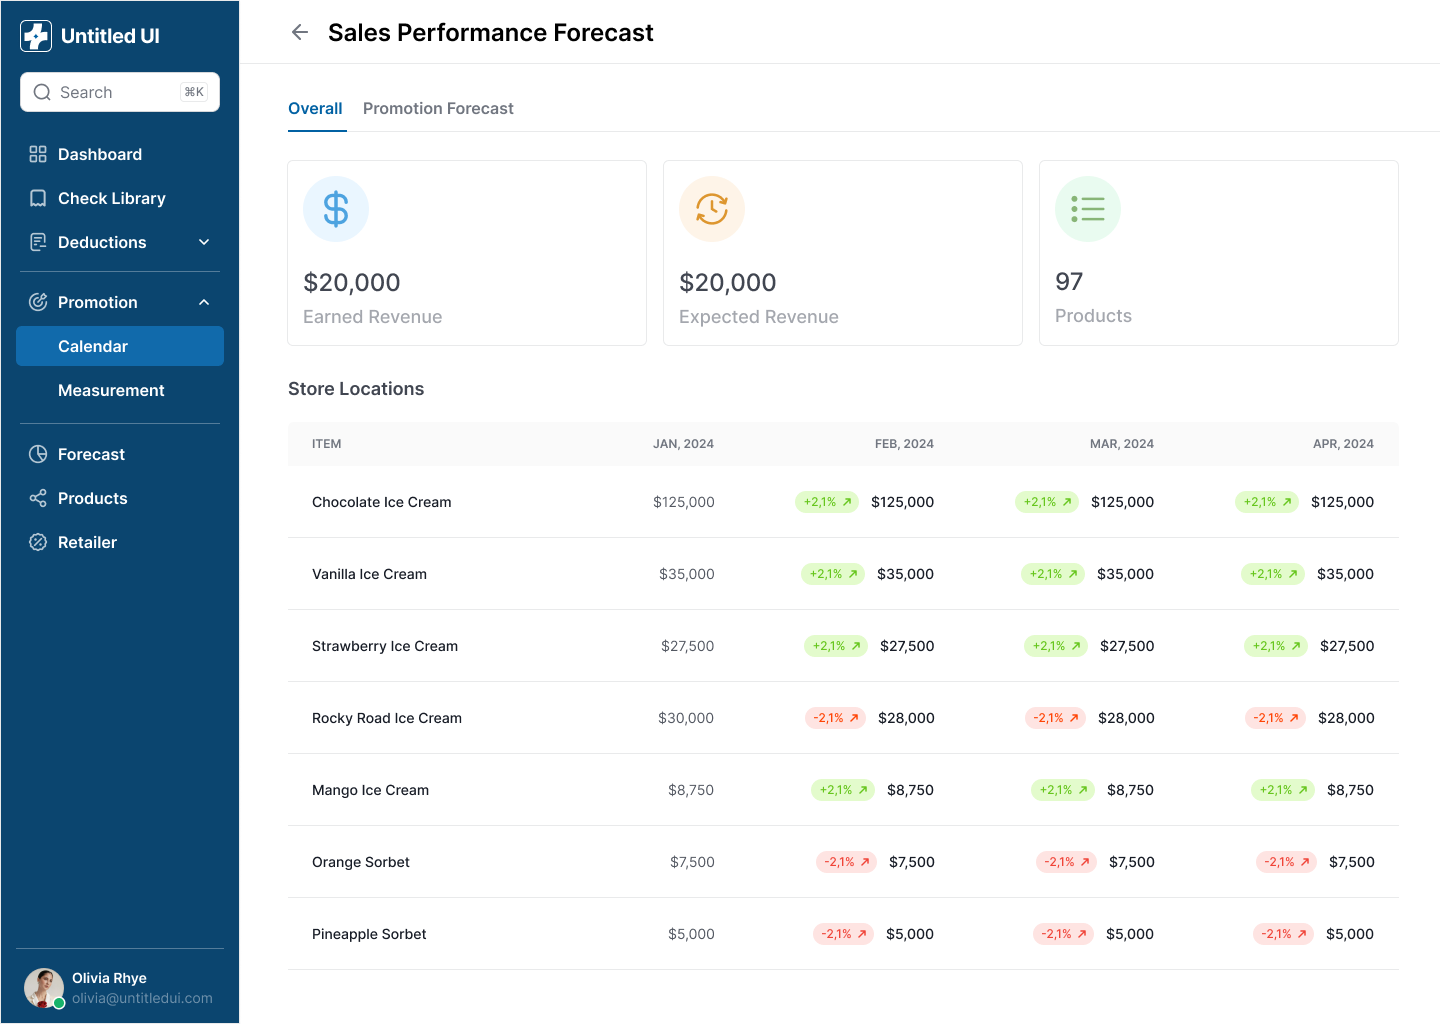
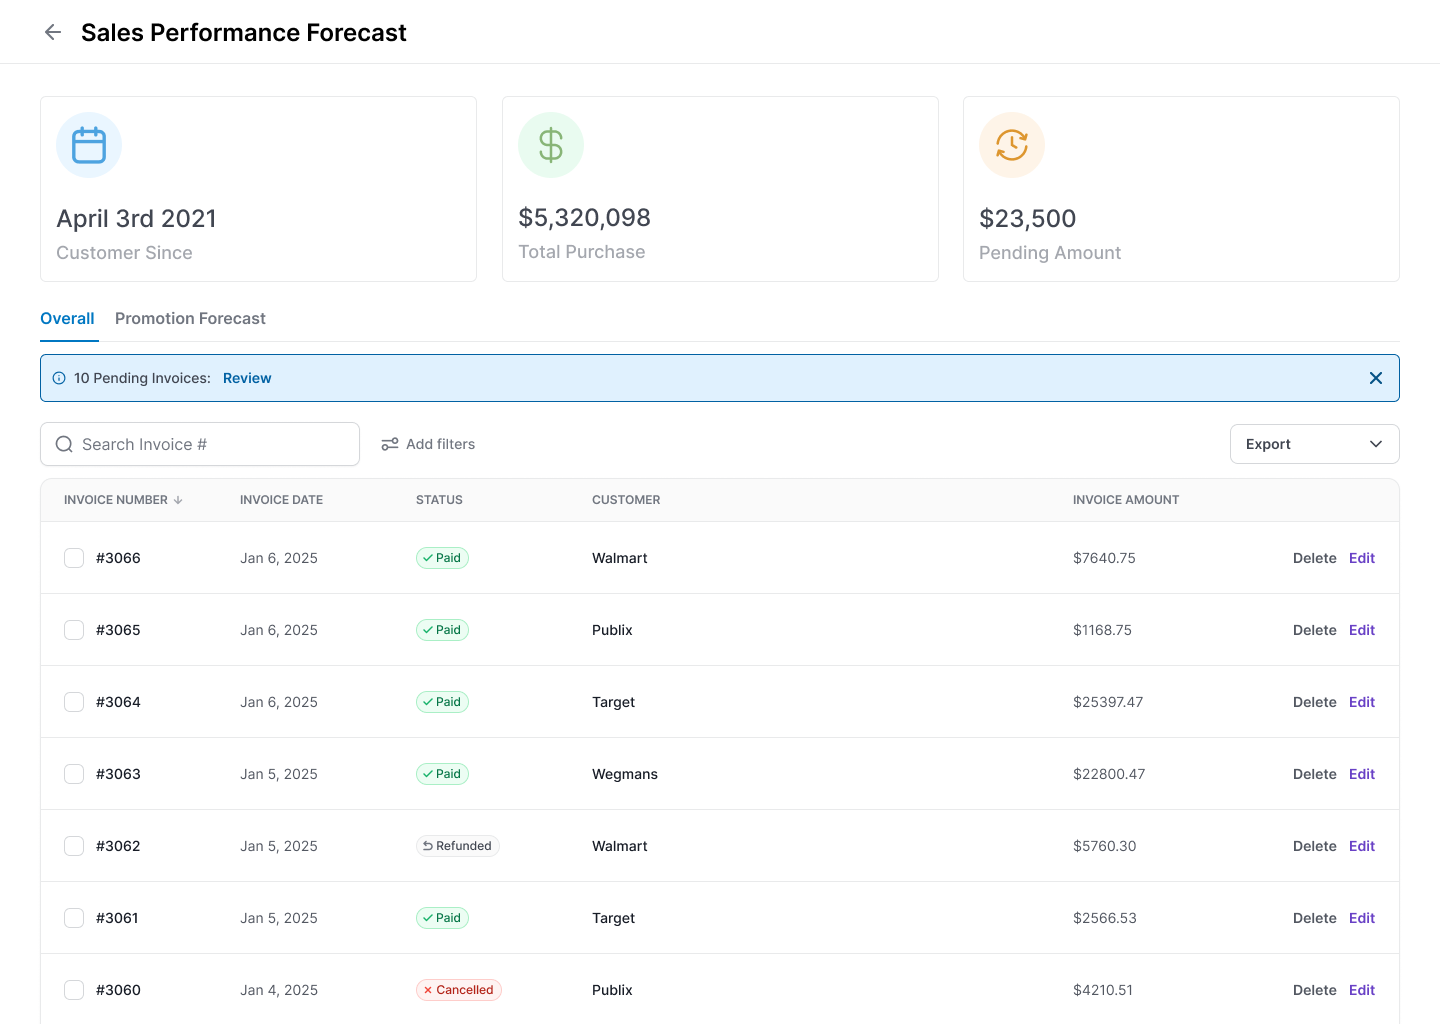
Sales Performance Forecast
Revenue metrics, month-over-month product performance table
Forecast Summary Cards
High-level forecast KPIs and summary metrics
05 — Information Architecture
Information Architecture
The navigation organizes the platform by functional domain rather than data type. The sidebar groups: Dashboard (aggregate view), Check Library (reconciliation), Deductions (validation and disputes), Promotion (Calendar and Measurement), Forecast (revenue projections), Products (catalog management), and Retailer (relationship management). This structure mirrors how CPG finance teams actually divide responsibilities — the person managing deductions isn’t the same person planning promotions.
Financial Operations
Dashboard · Check Library · Deductions
Revenue-facing views. The dashboard provides aggregate spend visibility. Check Library tracks reconciliation status. Deductions is where validation and dispute work happens — the highest-traffic section for finance teams.
Promotion Management
Calendar · Measurement
Planning-facing views. The Gantt calendar handles promotion scheduling and conflict detection. Measurement provides post-promotion analytics — comparing planned vs. actual lift to evaluate ROI.
Data & Relationships
Forecast · Products · Retailer
Reference views. Sales forecasting for revenue planning. Product catalog for SKU management. Retailer profiles for contact info, store locations, and relationship context.
06 — Component Patterns
Component Patterns
The platform handles extreme data density — product catalogs with hundreds of SKUs, deduction tables with thousands of line items, and promotion timelines spanning 12+ months. Three core component patterns maintain consistency while handling this complexity: metric cards for at-a-glance KPIs, data tables with advanced filtering for bulk operations, and the Gantt timeline for temporal visualization.
Metric Cards
Three-card summary rows appear at the top of every major view: Dashboard (promotion spend metrics), Checks Database (missing deductions, missing backup, total revenue), Sales Forecast (earned revenue, expected revenue, product count). Icon + large number + label format ensures instant readability.
Data Tables
Sortable columns, search/filter bars, status badges (Paid, Reconciled, Missing Backup, In Review), pagination, and bulk actions (Download, Export). Consistent across Checks, Deductions, Invoices, and Promotions. Detail panels slide in from the right rather than navigating away.
Gantt Timeline
Hierarchical left panel (Retailer → Category → SKU) paired with horizontal color-coded timeline bars. The 'today' marker provides temporal anchoring. Toggle between Gantt view and bar chart summary. Supports month-level zoom with horizontal scroll.
07 — Outcome & Reflection
Outcome & Reflection
Clovr is a validated platform design for a category with consolidation opportunity. The five incumbent TPM tools compete exclusively for enterprise accounts at $30K–$200K/year. The $10M–$200M revenue tier — mid-market CPG brands — has no purpose-built option and is currently served by spreadsheets and ERP exports. Every design decision was made against a specific failure mode in the competitive landscape: fragmented data across four to six systems per deduction, invisible patterns in retailer over-deduction behavior, and dispute windows that expire while teams are still manually validating claims they could have disputed weeks earlier.
0
Min per deduction validation
0
Annual recovery target
0
TPM competitors analyzed
0
Finance workflows unified
What I’d do differently
Conduct usability testing with 3–5 CPG finance teams to validate whether the three-panel deduction layout actually reduces validation time. The 45-to-10 minute estimate is based on workflow analysis, not measured task completion.
Design an automated deduction matching flow using AI suggestions — the current dispute modal requires manual reason selection, but pattern detection could pre-fill the most likely dispute reason based on historical data for that retailer and promotion type.
Build a deduction aging dashboard showing how long each open claim has been sitting relative to the dispute window deadline. Time-pressure visualization would help teams prioritize claims about to expire over recently received ones.
Run structured usability sessions with 3–5 CPG finance teams to validate the three-panel deduction layout under real workflow conditions. The 45-to-under-10-minute estimate is grounded in workflow analysis, but measured task completion data would either confirm the design or reveal where the layout breaks down at speed.
Next Project
Nexora
CRM & Sales Management Platform