Designing a unified CRM and sales management platform that gives small service teams real-time pipeline visibility — so they stop losing deals they should be closing.
Role
Product Designer
Timeline
2024
Tools
Figma, FigJam, Maze, Hotjar
Type
B2B SaaS — Concept
01 — The Problem
The Problem
Small service businesses running 2–8 person sales teams face a specific, measurable problem: they close fewer deals than they should — not because of bad salespeople, but because of invisible pipeline leakage. Deals stall in qualification, follow-ups slip through the cracks, and proposals go out without anyone tracking whether they converted. The team only notices when the monthly revenue number comes in short.
Existing CRM tools are built for enterprise sales orgs with dedicated ops teams. They require hours of configuration, force rigid workflows, and bury the metrics that actually matter under layers of customization. The result: small teams either abandon the CRM entirely or use it as a glorified contact list — which means pipeline data is scattered across spreadsheets, sticky notes, and memory.
"The average small sales team loses 20–35% of winnable deals to pipeline invisibility — not competitor pressure."
02 — Research & Discovery
Research & Discovery
To validate the problem space, I conducted competitive analysis across 6 existing CRM platforms (HubSpot, Pipedrive, Close, Freshsales, Salesforce Essentials, Monday Sales CRM) and synthesized findings from 15+ published user research reports on small-team sales workflows. The goal was to identify where existing tools fail small teams specifically — not where they fail in general.
Setup Paralysis
78% of small teams who adopt a CRM stop actively using it within 90 days. The #1 cited reason: the initial configuration burden. Small teams don't have a RevOps person to set up custom fields, automations, and pipeline stages.
Split Attention
Sales reps in small teams also handle invoicing, proposals, and client communication. Existing CRMs silo these functions — forcing reps to context-switch between 3–4 tools to manage a single deal from lead to payment.
Invisible Losses
Only 12% of small teams can accurately report why they lost a deal last quarter. Without structured loss-reason tracking, teams repeat the same mistakes — sending unclear proposals, following up too slowly, or losing to the same competitor.
03 — Key Design Decisions
Key Design Decisions
Unified Pipeline + Finance
Sales teams using separate tools for leads, proposals, and invoices lose context at every handoff. A deal closes in the CRM but the invoice lives in QuickBooks — nobody tracks if it actually gets paid.
Designed a single platform with shared navigation between Leads, Proposals, and Invoices. Deal data flows through the entire lifecycle without re-entry. The kanban board, proposal builder, and invoice table share a common contact record — one source of truth.
The ResultEliminates the context-switch tax. A rep can move from qualifying a lead to sending a proposal to tracking the invoice without leaving the platform or re-entering data.
Guided Onboarding Over Empty States
A new user logging into an empty CRM faces a blank dashboard — no data, no guidance, no momentum. This is where 78% of small team CRM adoptions die.
Designed a progressive onboarding state that replaces the empty dashboard with three actionable setup cards: send a test invoice, send a test proposal, configure payment methods. Each card has a clear illustration and a single CTA. The real dashboard analytics appear below, already populated with sample data to show what the tool looks like in use.
The ResultThe user's first session has a clear path forward. They complete setup tasks and immediately see the dashboard populate — building confidence that the tool is worth investing in.
Loss Reason Visibility
Small teams don't track why they lose deals. They know they lost — they just don't know to what. Without structured loss data, they can't improve their sales process.
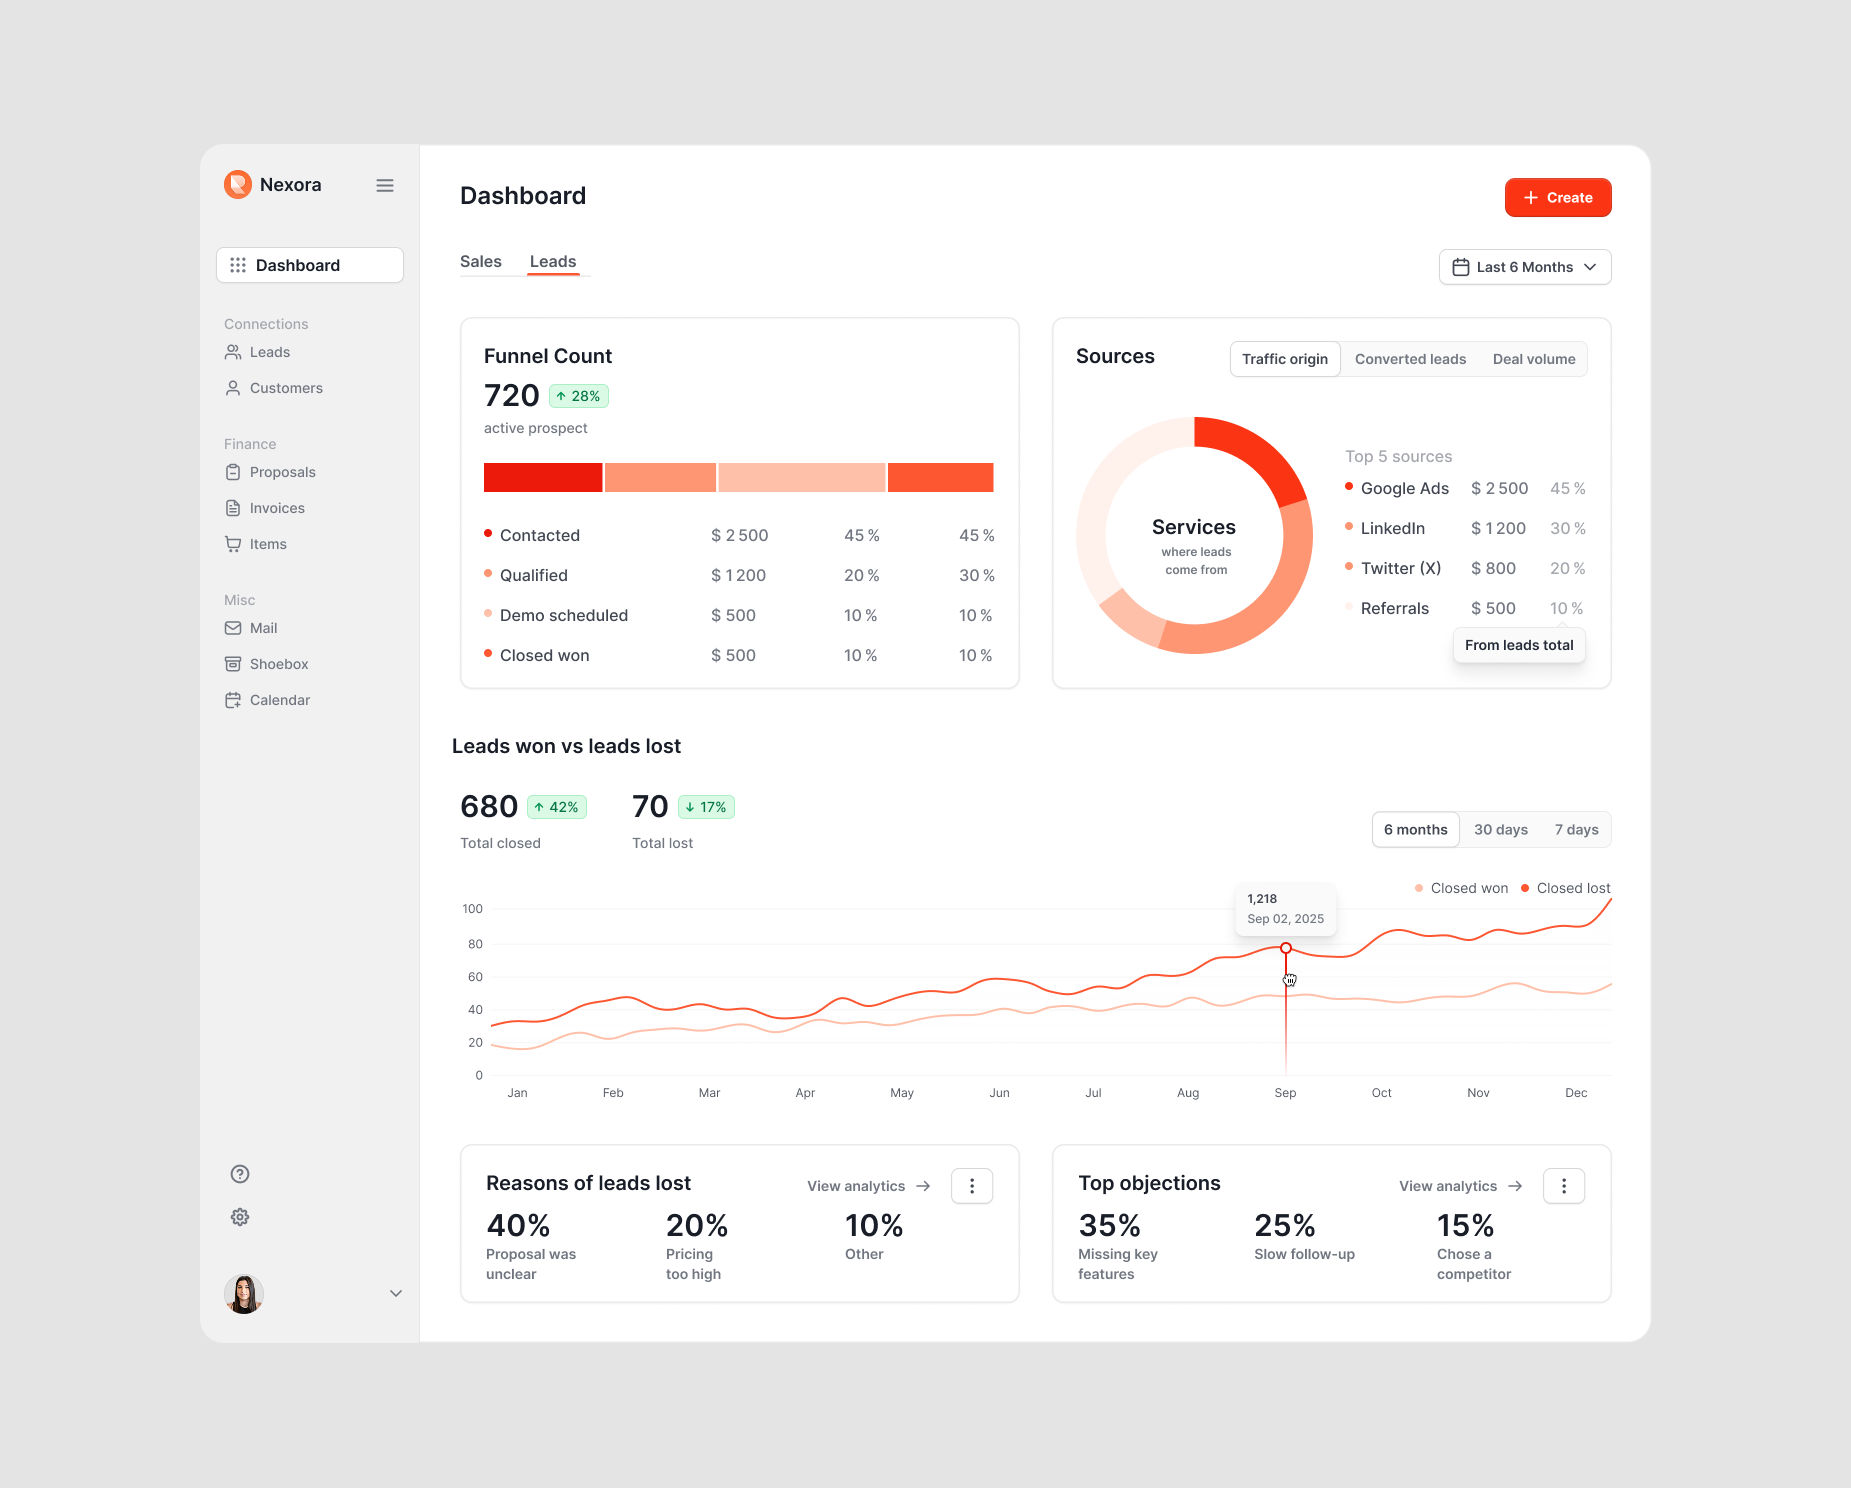
Designed a 'Reasons for Leads Lost' card and a 'Top Objections' card directly on the Leads dashboard tab. These surface the top 3 loss reasons and objections with percentage breakdowns — no clicks, no drill-downs, no buried reports. The data is immediately visible alongside the pipeline metrics.
The ResultTeams can identify patterns — 'our proposals are unclear' (40%) or 'we're losing to slow follow-up' (25%) — and take targeted action. This turns the dashboard from a reporting tool into a coaching tool.
Zero-Config Start as Competitive Commitment
Every CRM competitor offers deep customization — custom pipeline stages, custom fields, custom automations. This is marketed as flexibility. In practice, it's the reason 78% of small team adoptions fail within 90 days: the product refuses to be useful until it's been extensively configured, and small teams don't have a RevOps person to do that work.
Designed Nexora with a working default state for every view. Pipeline stages are pre-set (Discovery → Qualified → In Conversation → Closed). Dashboard cards populate with sample data from day one. The onboarding flow has three actions total — test invoice, test proposal, configure payments — and the full product is usable after all three. Customization exists but is never required to get value in the first session.
The ResultThe design commitment shapes every IA decision: if a feature requires setup to understand, it was either removed or pre-configured. Small teams don't want to choose their pipeline stages — they want a pipeline that reflects how they already sell, which is almost always the same four stages. Nexora's competitive position is not a feature list. It's a promise: useful on day one, not after a week of setup.
04 — The Solution
The Solution
Nexora is a CRM and sales management platform designed specifically for small service teams — the 2–8 person shops that need pipeline visibility without enterprise complexity. The platform unifies lead management, proposals, and invoicing under one roof, with a dashboard that surfaces the metrics that actually drive revenue: funnel conversion, deal velocity, loss patterns, and lead source ROI.
01 / 06
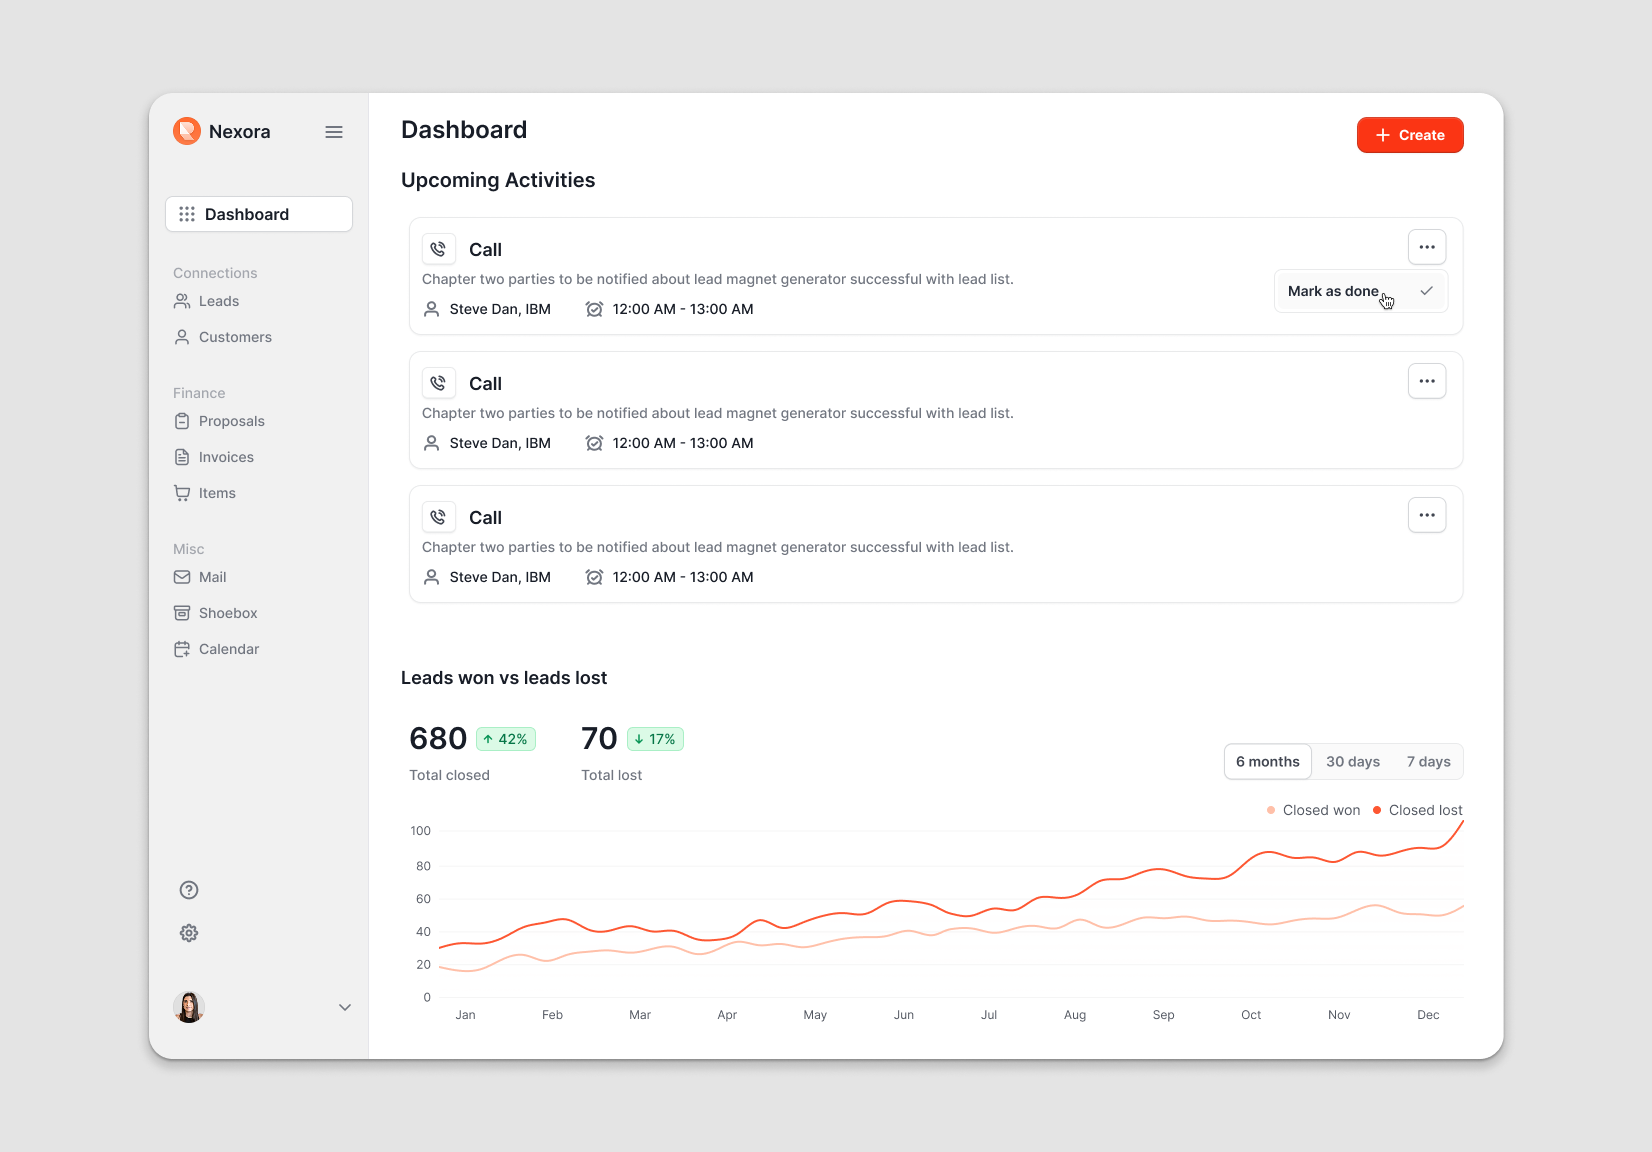
Sales Dashboard
Upcoming activities with contact context, win/loss trend chart
Leads Dashboard
Funnel count, lead sources donut chart, loss reasons

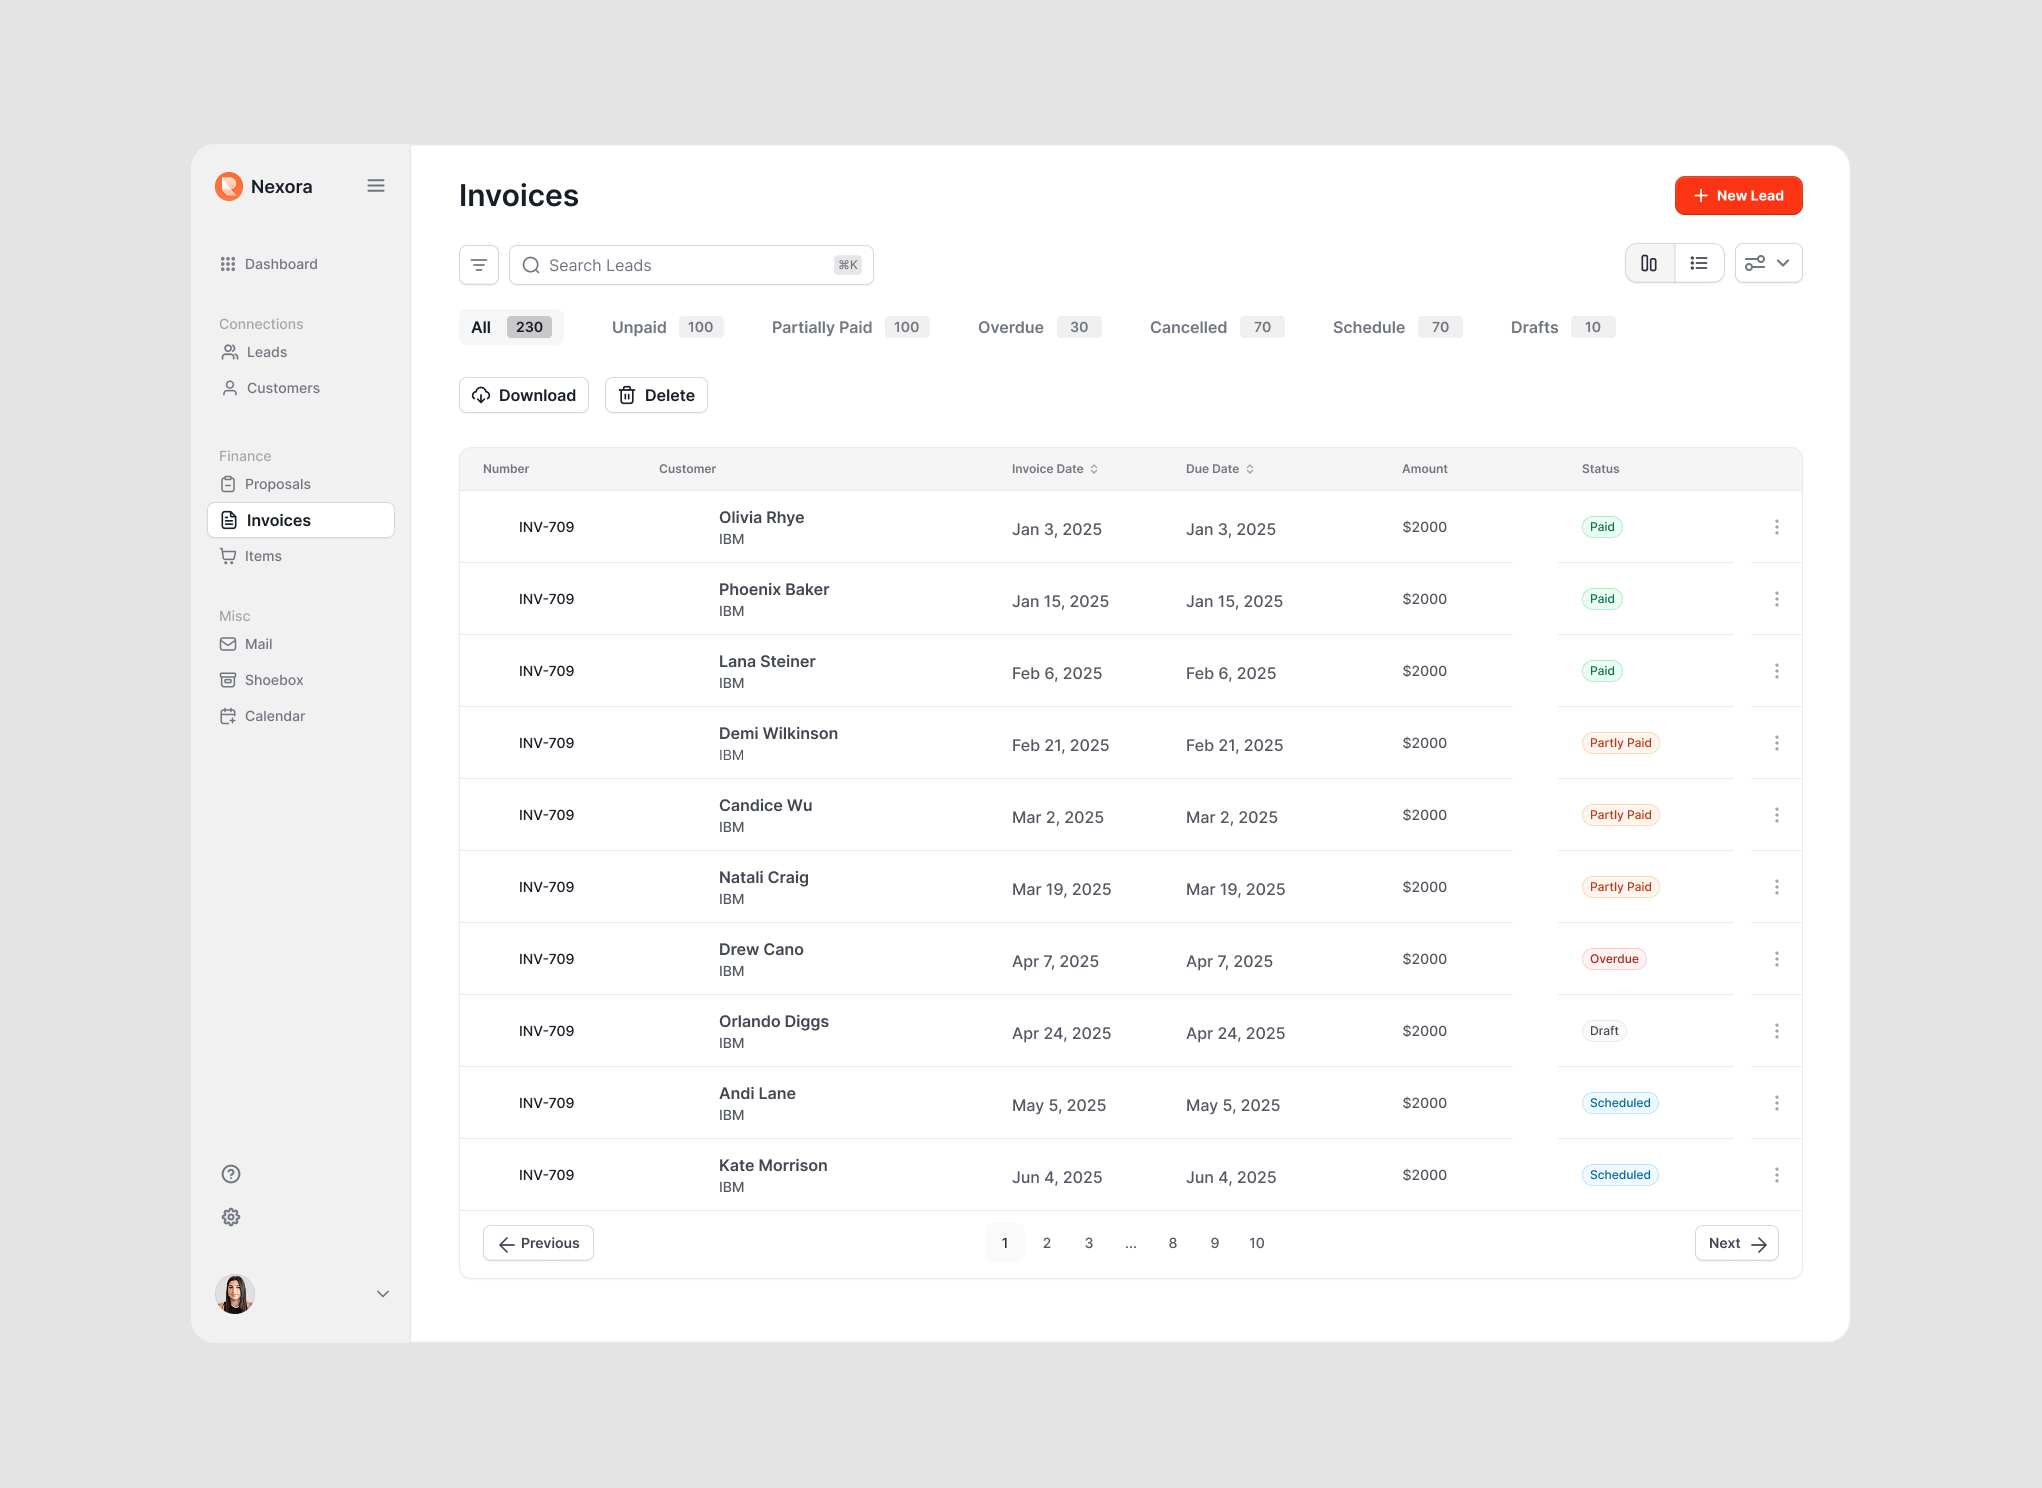
Invoices Table
Status filter tabs, sortable columns, pagination, status badges
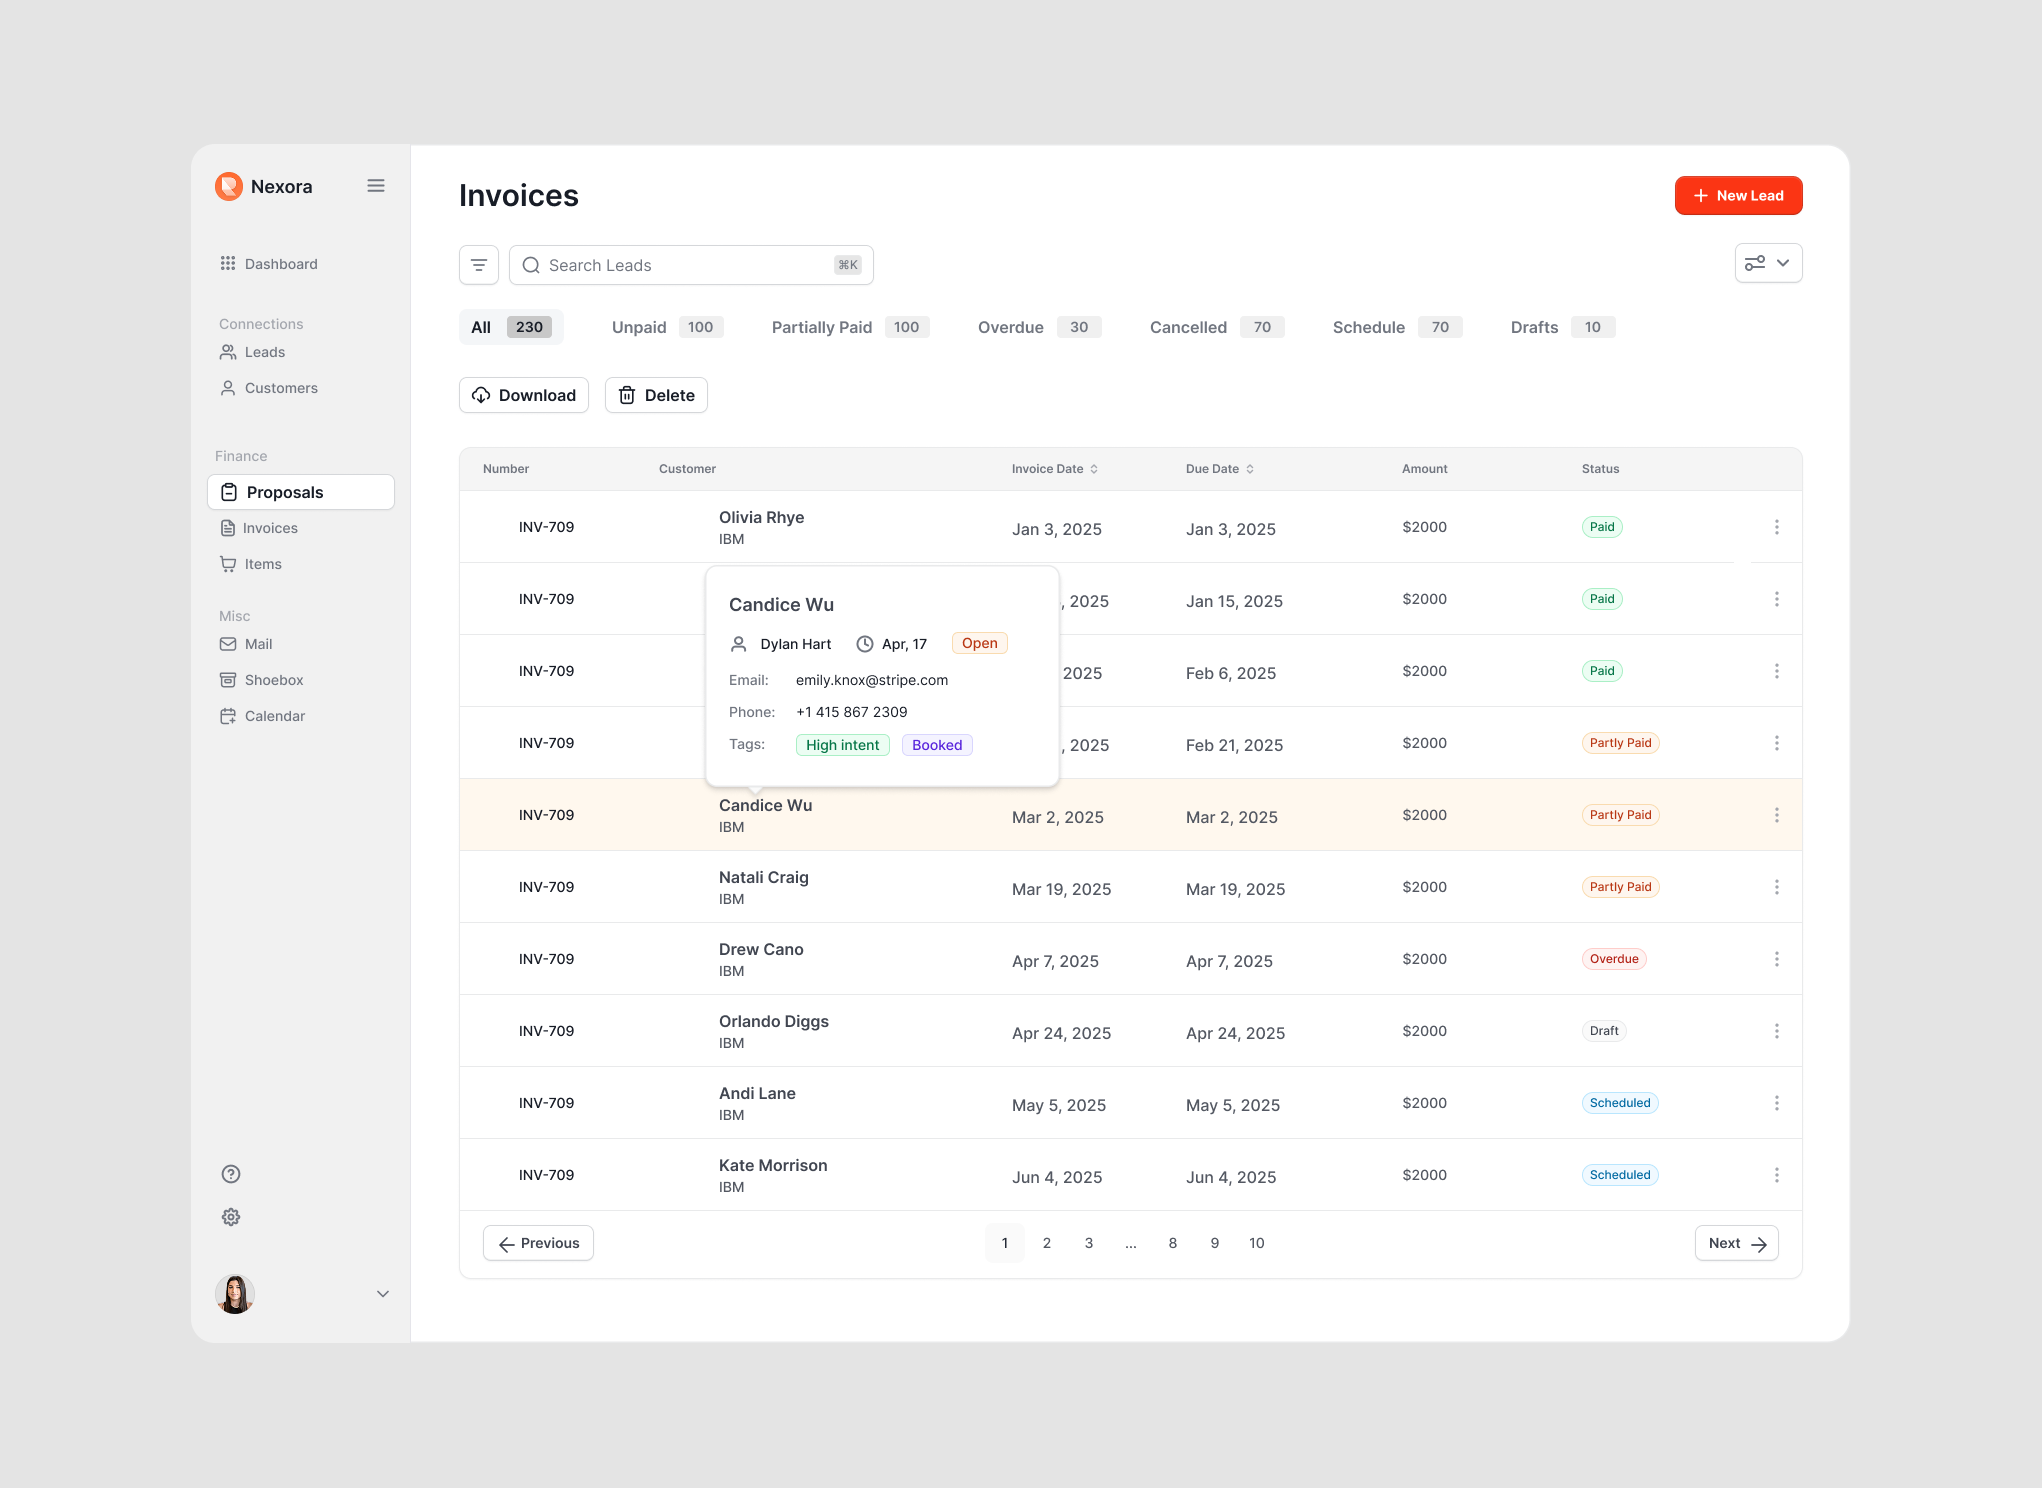
Proposals with Popover
Hover contact details: assigned rep, email, phone, tags
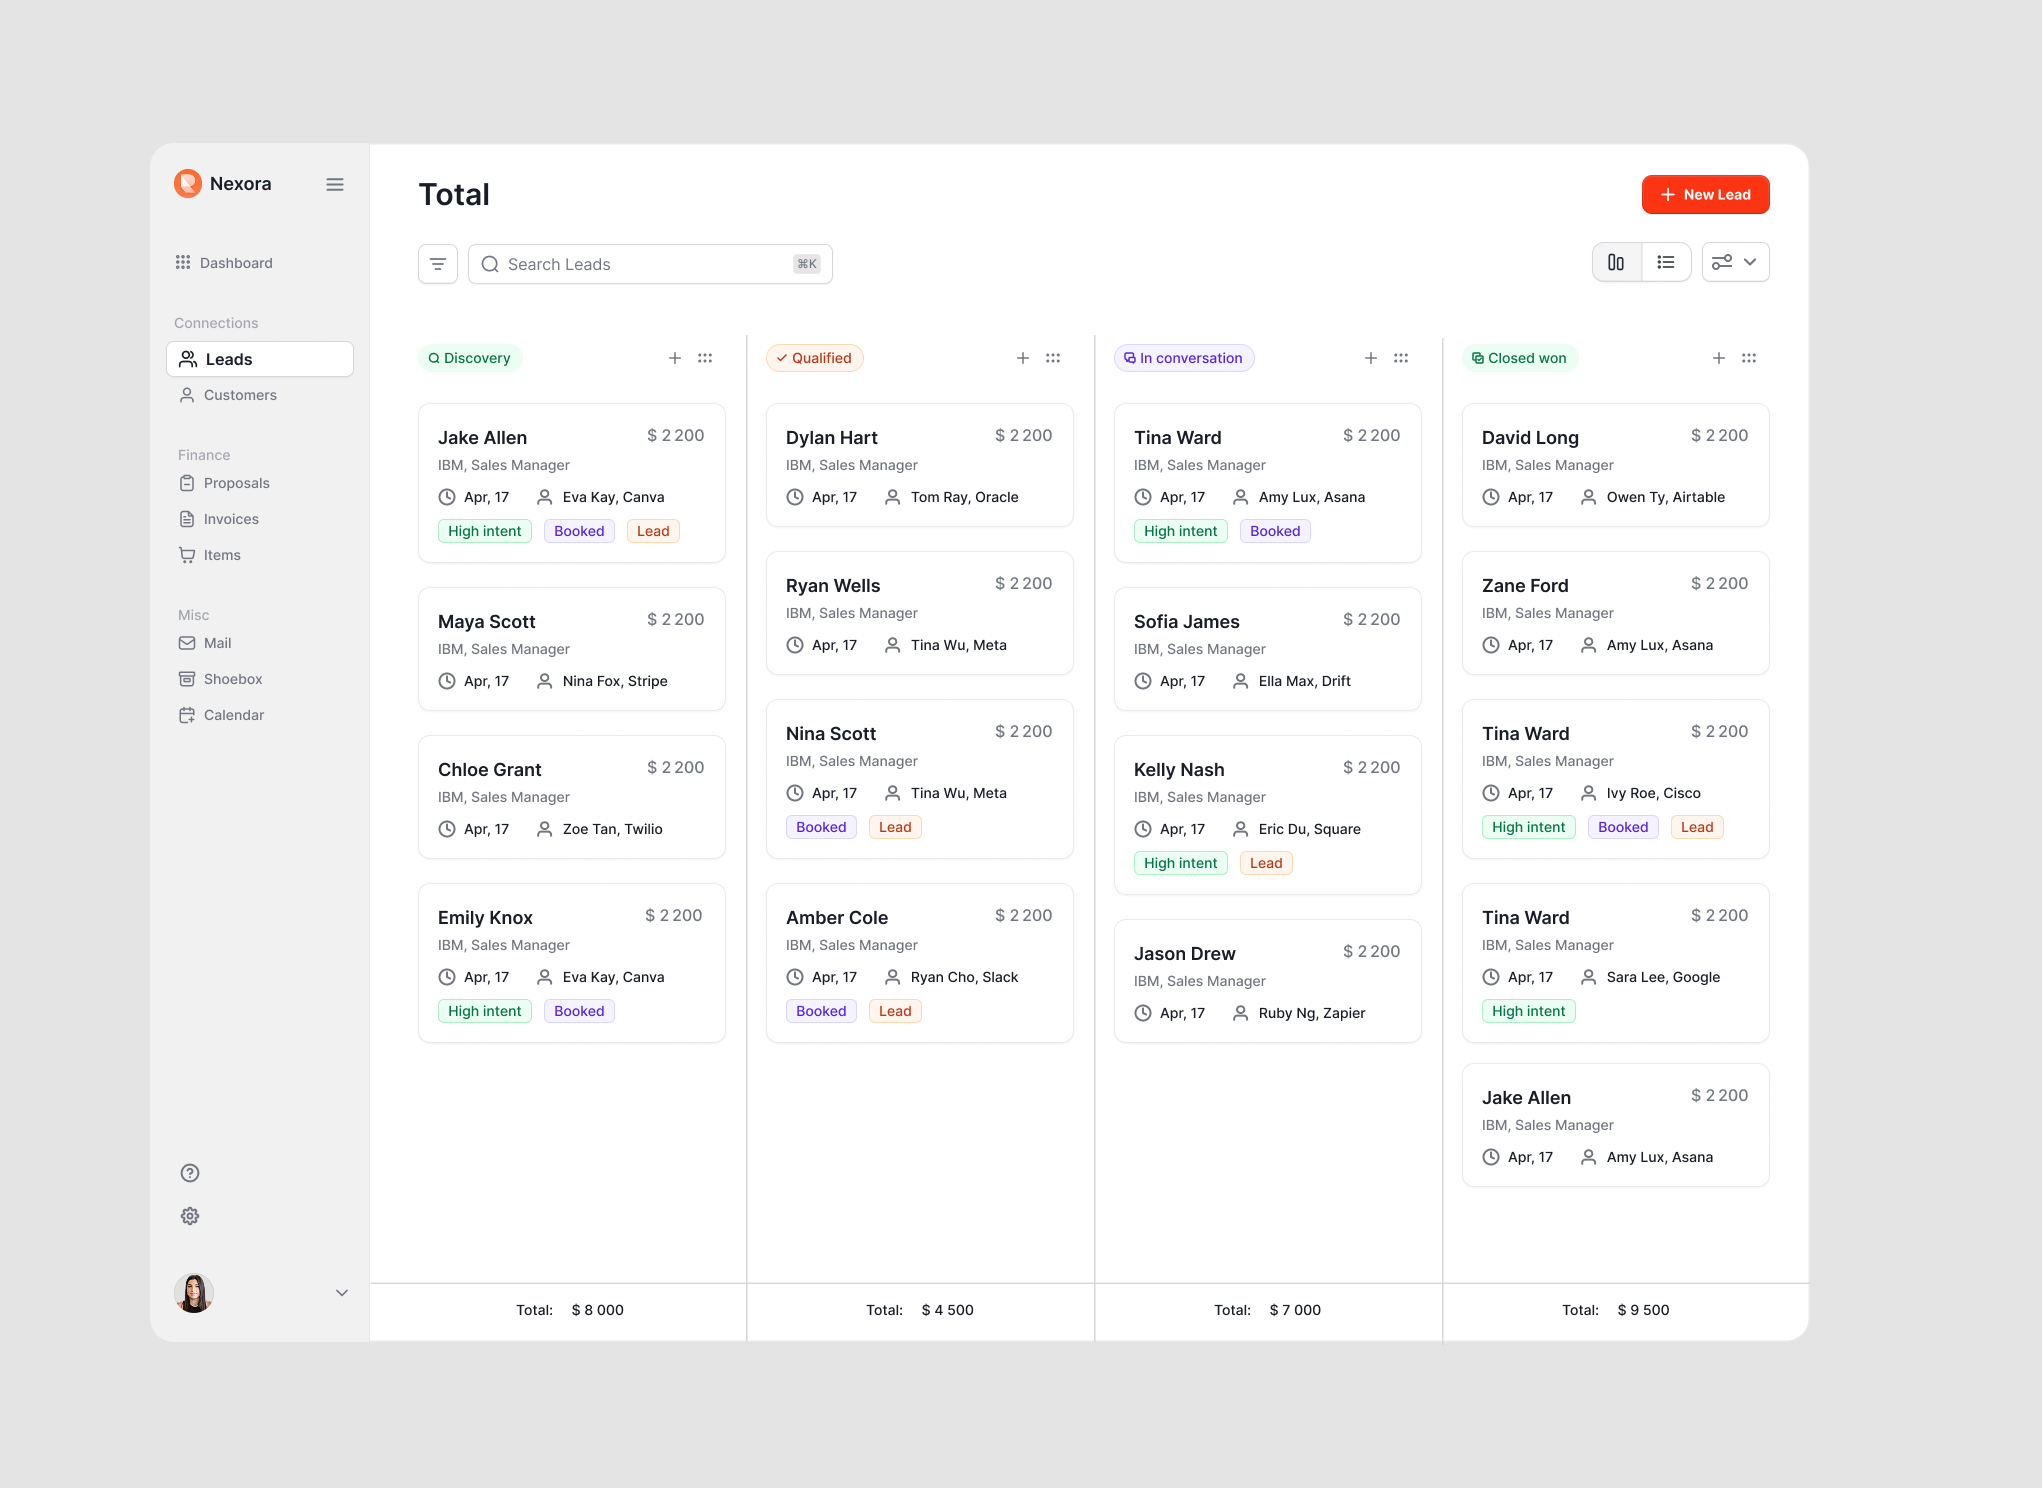
Leads Kanban Board
4-column pipeline: Discovery → Qualified → In conversation → Closed won
Onboarding State
Progressive setup cards replacing the empty dashboard
05 — Information Architecture
Information Architecture
The navigation structure groups functionality by user intent rather than data type. Instead of organizing by objects (contacts, deals, activities), the sidebar groups by workflow: Connections (Leads, Customers), Finance (Proposals, Invoices, Items), and Misc (Mail, Shoebox, Calendar). This mirrors how a sales rep actually thinks about their day — not 'I need to access a contact record' but 'I need to follow up on a deal' or 'I need to send an invoice.'
Connections
Leads · Customers
Pipeline-focused views. The kanban board for active deal management, list views for filtering and search, and customer records for post-close relationship tracking.
Finance
Proposals · Invoices · Items
Revenue-focused views. Proposals and invoices share a consistent table pattern with status filters, sortable columns, and inline contact popovers — reducing the learning curve between sections.
Misc
Mail · Shoebox · Calendar
Support tools. Communication, document storage, and scheduling live outside the primary workflow but are always one click away in the sidebar.
06 — Dashboard Design Philosophy
Dashboard Design Philosophy
The dashboard uses a tab pattern — Sales and Leads — to separate two distinct user mindsets. The Sales tab answers 'what do I need to do today?' with upcoming activities and a win/loss trend. The Leads tab answers 'how is our pipeline performing?' with funnel metrics, source attribution, loss reasons, and objection patterns. This separation prevents cognitive overload while keeping both views one click apart.
Action-Oriented
Upcoming activities with contact context (name, company, time). One-click 'Mark as done' action. Win/loss trend chart with period filters (6 months, 30 days, 7 days). The user opens this tab to answer: 'Who do I need to call right now?'
Analysis-Oriented
Funnel count showing conversion at each stage (Contacted → Qualified → Demo → Closed won) with dollar values. Lead source donut chart. Loss reason and objection breakdowns. The user opens this tab to answer: 'Where are we leaking deals and why?'
07 — Component Patterns
Component Patterns
Consistency across the platform reduces cognitive load. Three core patterns repeat throughout the product: card-based dashboard widgets for scannability, data tables with status filters for dense information, and kanban columns for spatial pipeline management. Each pattern was designed once and applied across contexts — the invoices table and proposals table share identical structure, differing only in data fields.
Data Tables
Consistent column structure: sortable headers, status badges (Paid, Partly Paid, Overdue, Draft, Scheduled), pagination, bulk actions (Download, Delete). Status filter tabs with counts sit above every table.
Kanban Boards
4-column pipeline view: Discovery → Qualified → In conversation → Closed won. Deal cards surface name, company, value, date, assigned rep, and intent tags. Column totals at bottom provide instant pipeline value.
Contact Popovers
Hover on any contact name in a table to see a lightweight popover with: assigned rep, date, status, email, phone, and tags. Enables quick context without navigating away from the current view.
08 — Outcome & Reflection
Outcome & Reflection
Nexora is a concept-stage platform design validated through competitive analysis of six CRM tools and synthesis of small-team sales research. The central design thesis — that small teams fail at CRM adoption because of configuration burden, not capability gaps — is supported by published adoption data. Every major design decision traces back to one failure mode in the competitive landscape: HubSpot and Pipedrive are powerful, but they are built for teams with the operational bandwidth to configure and maintain them. Nexora is built for teams that don't have that bandwidth and shouldn't need it.
0
CRM abandonment rate addressed
0
Tools consolidated
0
CRMs analyzed in research
0
Config required to start
What I'd do differently
Conduct usability testing with 5–8 small sales teams to validate the onboarding flow reduces setup abandonment. The progressive disclosure hypothesis needs real-world data.
A touch-native companion for the kanban board is a deliberate stage-2 problem. Sales reps work from their phones, but a touch-optimized pipeline card interaction is a different design problem from the desktop layout — different density, different tap targets, different navigation model. The desktop-first design is the right starting constraint for V1. Mobile is scoped to V2 specifically to avoid designing for two interaction models simultaneously before the core flows are validated.
Add a deal velocity metric to the Leads dashboard — not just where deals are in the pipeline, but how long they've been sitting at each stage. Stale deals are the silent killer of small team revenue.
Next Project
Keel
Governance for AI-Authored Design Systems